Take a look at the spreadsheets in your life, and you will notice that every sheet falls into one of two categories:

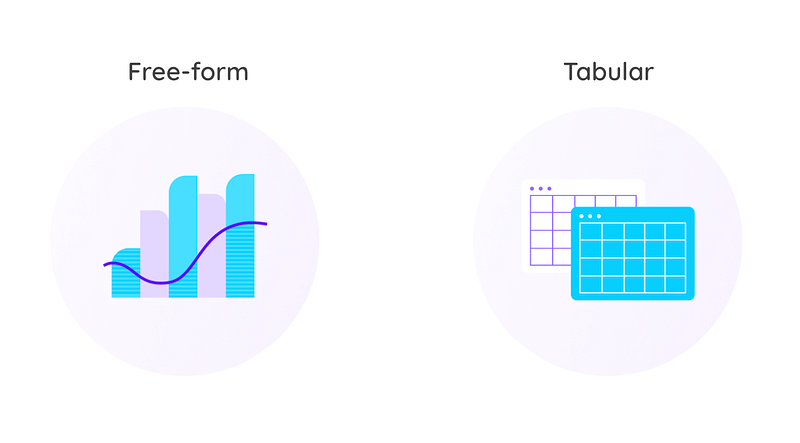
- Free-form: Your typical spreadsheet model with quite a lot of inputs/assumptions, interim calculations and results. The layout is loosely organized, and often more for the sake of human consumption than formal structure.
- Tabular: In fact a single table “database” with column headers in the first row and each subsequent row holding details of an entity, transaction, log entry or similar. Each column has an expected type (such as text, date or a numerical value). These rarely have calculations, and if they do, they are formulas that repeat for every row in a given column.
Every indication we have in our research and experience at GRID is that free-form and tabular sheets are about equally common.
Our stated mission is to be the numbers tool for the next generation, and as such, we historically paid more attention to the free-form sheet, helping users communicate their spreadsheet models, answering “what-if questions” and reporting on the numbers in their sheets.
At the same time we leave the use-case of replacing “human scale databases” to players such as Notion, Airtable and Smartsheet that are there for people when they realize that traditional spreadsheet software such as Excel and Google Sheets may not fully meet their database needs.
But databases nevertheless hold data that needs to be sliced and diced, reported on, interacted with and quantified. In other words — numbers. Even databases with no numerical data are often summarized and visualized so that the data can be better understood, answering questions such as:
- Number of employees by department?
- Number of customers by state?
Similarily, when there are numbers in the databases, you are typically looking to answer questions such as:
- Average salary by department and age?
- Total sales by state?
These aren’t answered by looking at the raw numbers in the database, but by aggregating the numbers (e.g. sum, average, max or min) in one column by grouping, filtering and sorting by attributes in other columns. This is the realm of Business Intelligence or BI — professional analytics tools that at their core provide insights into large volumes of data by simply filtering, grouping, aggregating and sorting them into charts or tables consumable by humans.
In the spreadsheet world, these needs have been addressed with pivot tables, a fairly advanced “bolt on” to the traditional spreadsheet, that’s known for its power, but not necessarily its ease of use. In our experience the number of users that know how to use pivot tables is at least an order of magnitude smaller than those that write simple formulas.
With the rise of next-gen productivity tools such as Notion and Airtable, we’ve seen a rising demand for a much more user friendly way to work with tabular data and these last few weeks, we’ve begun delivering a range of product capabilities to better meet them. Including:
- Chart Builder: A simple point and click interface allowing you to point at any data coming out of these tools and easily build the chart or table you want by summarizing the tabular data.
- AI Chart Assistant: A natural language assistant that populates the chart builder based on your prompt and allows for further customization if needed.

- Structured sheets: As of this week, there are two distinct types of sheets within GRID. On the one hand, your typical free-form spreadsheets and on the other new “structured sheets” to facilitate numbers work on top of tabular data. Structured sheets come with a different UI and a different set of functionalities, tailored for working with and quantifying this type of data. And the best thing is that you can still mix and match the two types, for example aggregating historical information from a structured sheet to use your actual numbers as the basis for a free-form spreadsheet model with your forecast.
As of yet, these new features have only been enabled on top of data coming from Notion and Airtable, but later this year our own GRID Sheets will allow you to create structured sheets from scratch, right within GRID.
— — —
Have an opinion about this? Tell me what you think on Twitter or go ahead and give GRID a spin.