When working with data preparation, analytics and visualization software, a few data sets show up again and again. A short while ago, I posed a question about people’s favorite demo data sets on Twitter.
Below you will find a selection of a few of the data sets people mentioned — as well as some of my own favorites — with a short description and a link to the raw data. In selecting the data sets from the larger list of suggestions I aimed for variability in size, format and topic.
If you think I’ve missed something important or have additional suggestions, feel free to leave a comment below.
Titanic passengers
A list of all passengers on the Titanic with several attributes, including name, class, age, gender and whether or not they survived.
- Size: 14 attributes, 1311 lines
- Useful for: Ad-hoc and predictive analysis (what do those that survived have in common?)
- URL: https://github.com/Geoyi/Cleaning-Titanic-Data
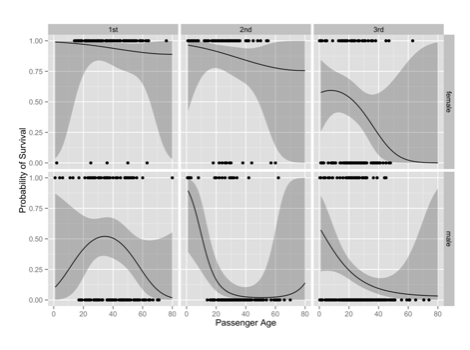 Titanic data visualization from Zachary M. Jones
World Population Prospects
Probably the most comprehensive global population database. Available at various levels of details and focus. The “Population by age groups” files are in many ways the most interesting.
- Size: Estimated and projected population by sex and 5-year age group for 241 countries and country groups, annual for 150 years
- Useful for: Hierarchies, medium-sized data, time-series, data concatenation.
- URL: https://esa.un.org/unpd/wpp/Download/Standard/Population/
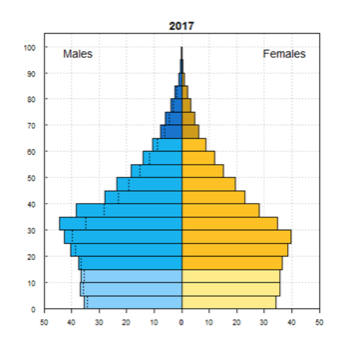 Population pyramid from UN DESA Population Division
Gapminder’s GDP per capita vs. child mortality
The data behind Hans Rosling’s first and most famous TED talk in 2006. The animated scatterplot with Dr. Rosling’s sport-game-like commentary changed data storytelling from a nerd pastime to a world-changing endeavor.
- Size: Two 240 year time-series for approx. 200 countries and regions
- Useful for: Animated scatterplots, data storytelling
- URLs:GDP per capita: https://github.com/open-numbers/ddf–gapminder–gdp_per_capita_cpppChild mortality: https://github.com/open-numbers/ddf–gapminder–child_mortality
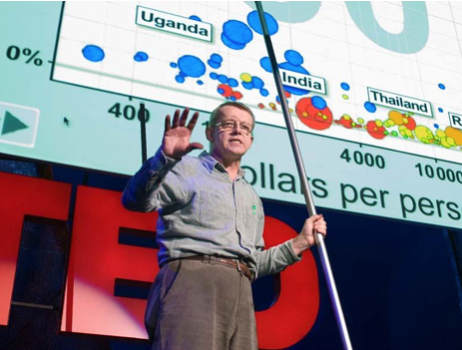 Hans Rosling presenting at TED
Significant Earthquakes Database
A database of large and/or particularly destructive earthquakes over the course of the last ~4000 years.
- Size: Approx. 5500 earthquakes with about 50 attributes for each.
- Useful for: Geospatial data. Hierarchical data.
- URL: https://www.ngdc.noaa.gov/nndc/struts/form?t=101650&s=1&d=1
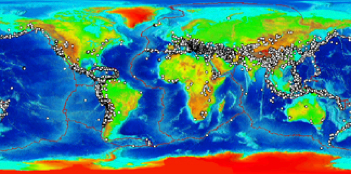 Map of significant earthquakes from NOAA
Enron emails
The text and meta-data for about 500,000 emails sent from 150 people — mostly senior management — at Enron before their collapse. The emails were made public by the Federal Energy Regulatory Commission during its investigation.
- Size: 500,000 emails of various lengths with a handful of meta-data fields each.
- Useful for: Unstructured data. Network analysis.
- URL: https://www.cs.cmu.edu/~./enron/
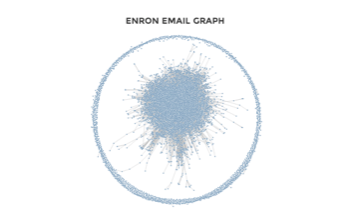 Enron email graph by Nathaniel Wroblewski
Anscombe’s quartet
Four data sets of 11 data points each that have nearly identical descriptive statistics, yet are very different when visualized. Constructed by statistician Francis Anscombe. Also, check out the recent The Datasaurus Dozen![]() that plays homage to Anscombe’s (and Alberto Cairo’s
that plays homage to Anscombe’s (and Alberto Cairo’s![]() ) work in an interesting way.
) work in an interesting way.
- Size: 4 data sets with 11 2-dimensional data points (22 values) each
- Useful for: Demonstrating the power of visualization; how summary statistics can be deceiving; and the effect of outliers.
- URL: https://en.wikipedia.org/wiki/Anscombe%27s_quartet
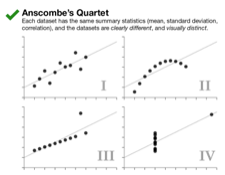 Anscombe’s Quarted as visualized by Justin Matejka and George Fitzmaurice
Les Miserables
Weighted network of co-appearances of characters in Victor Hugo’s novel “Les Misérables”. Nodes represent characters, edges connect pairs of characters that appear in the same chapter of the book and the values on the edges the number of such chapter co-appearances.
- Size: 76 character nodes with 254 weighted edges
- Useful for: Network graphs
- URL: https://networkdata.ics.uci.edu/data.php?id=109
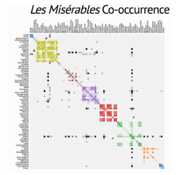 Les Misérables co-occurance as visualized by Mike Bostock
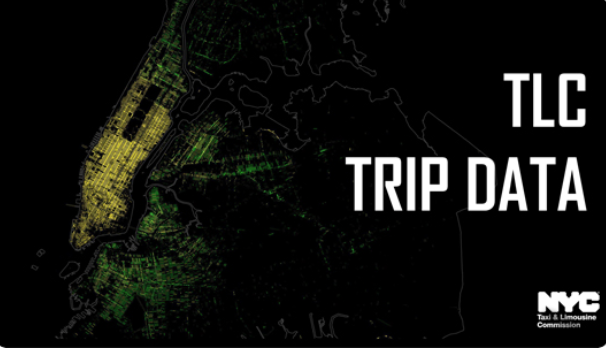
TLC Trip Data
Details about millions of taxi & limousine trips in NYC from 2009 through 2016 (updated annually).
- Size: Approx. 20 attributes for a few million trips monthly since 2009
- Useful for: (Somewhat) Big Data, Geospatial data
- URL: http://www.nyc.gov/html/tlc/html/about/trip_record_data.shtml
Napoleon’s March
The data behind one of the most famous data visualizations of all times, Charles Joseph Minard’s map of Napoleon’s disastrous march into Russia in 1812.
- Size: 3 small data sets with geo-locations, city names, dates, troop sizes and temperatures.
- Useful for: Geospatial data, visualization recreation, data variety, data storytelling
- URL: https://www.cs.uic.edu/~wilkinson/TheGrammarOfGraphics/minard.txt
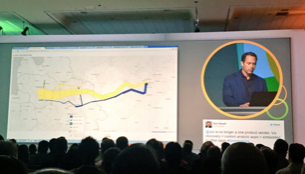 Qlik’s Drew Clarke recreating Minard’s map in Qlik Sense on stage
TPC benchmarks (Transaction Processing Performance Council)
Possibly the most “boring” of this bunch, the TPC benchmarks are not an actual dataset, but a set of tools for generation of realistic transactional data, data structures, volumes and database loads. Frequently used for benchmarking of enterprise software.
- Size: Can generate almost any size of fairly complex relational database structures.
- Useful for: Big Data; testing and benchmarking of heavy data loads.
- URL: http://www.tpc.org/information/benchmarks.asp
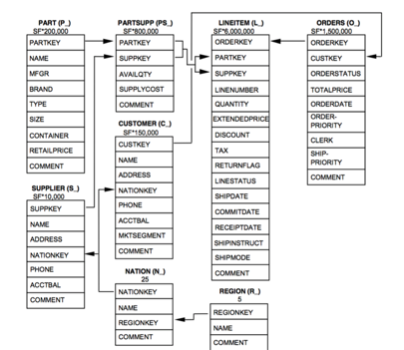 TPC-H data structure from Neo4j