Originally published on the GRID blog.
Spreadsheet software is one of the market segments where at any given time there has been one dominating market leader. I believe that understanding how the leadership role in this market changed hands over time can teach anyone trying to disrupt or simply enter an established market some valuable lessons.
First a bit of history
VisiCalc
The first spreadsheet — VisiCalc — was released in 1979 and held ground as the clear market leader in the early years despite dozens if not hundreds of other spreadsheet solutions being released in the first few years of personal computing.
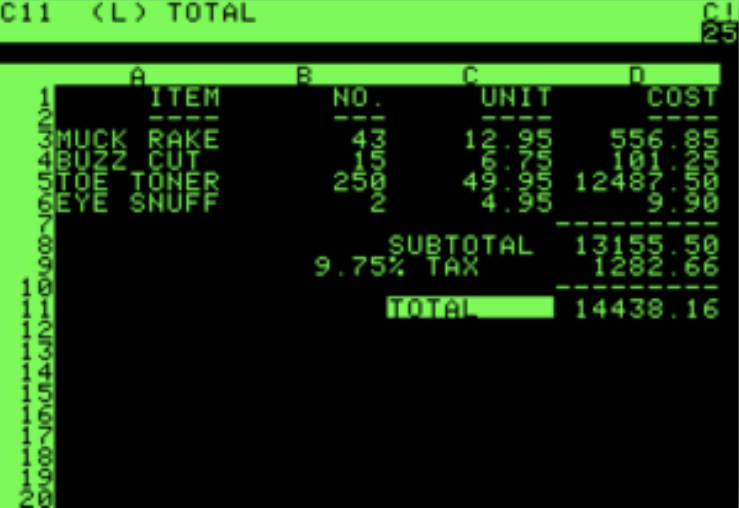 VisiCalc (~1980)
Lotus 1–2–3
Lotus 1–2–3 came along in the 1983. It grew extremely fast, due in large part to the rise of IBM PCs. 1–2–3 made the most of the more powerful calculation capabilities of the PCs, where as the competition ported their Apple II software without many adjustments. Lotus 1–2–3’s built-in charting capabilities (in fact the number 3 in “1–2–3” stands for “charts”) helped seal its popularity, and by 1984 they were the undisputed leader in the spreadsheet market, despite efforts such as Microsoft’s Multiplan, and Borland’s Quattro Pro.
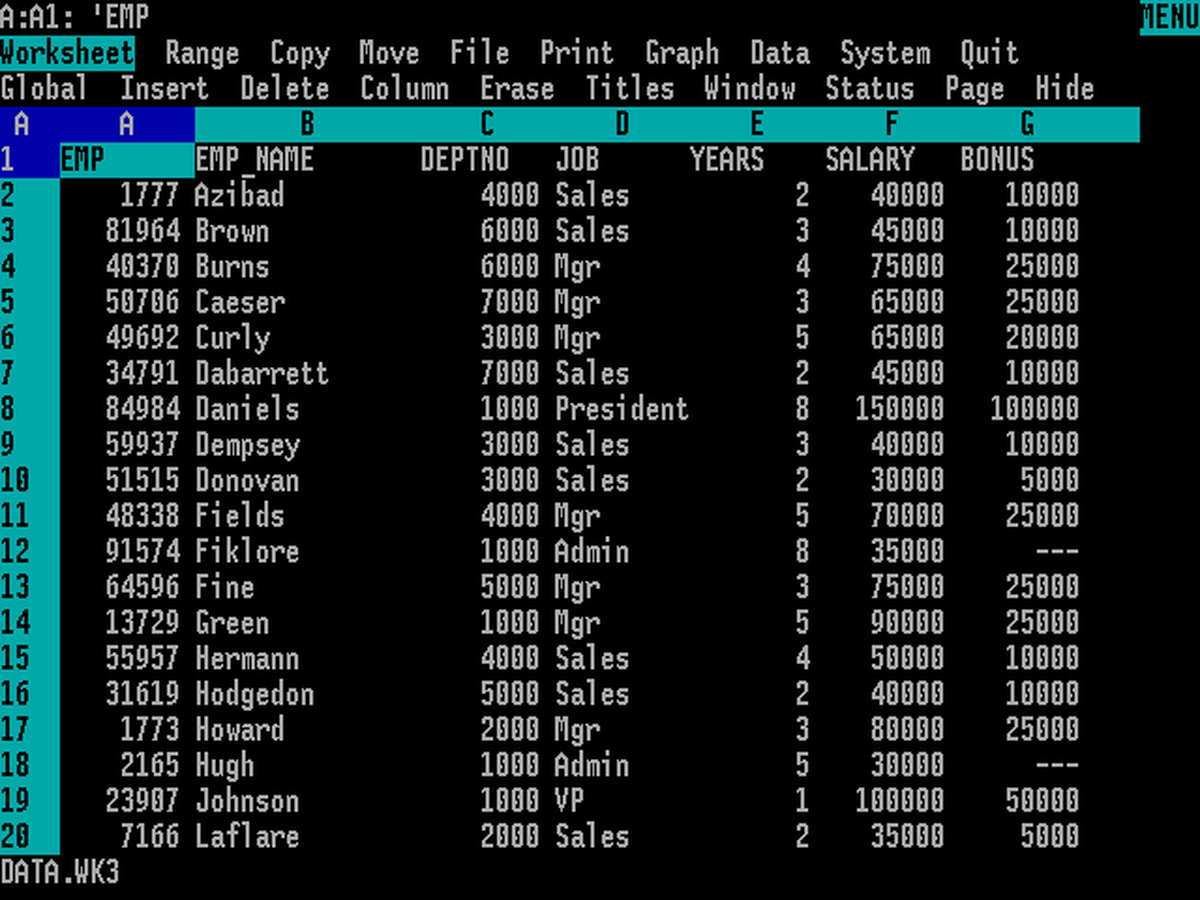 Lotus 1–2–3 (~1984)
Excel
Excel — which interestingly was originally released for Macintosh in 1985, and didn’t make its IBM PC debut (as “Excel 2”) until 1987 — grew in popularity in the late 80s together with the rise of Windows, and had become the market leader by the early 90’s. In addition to a windowed UI, Excel’s color graphics and — not to be discounted — its focus on beautiful laser printing, played a big role in Excel’s claiming of the spreadsheet throne.
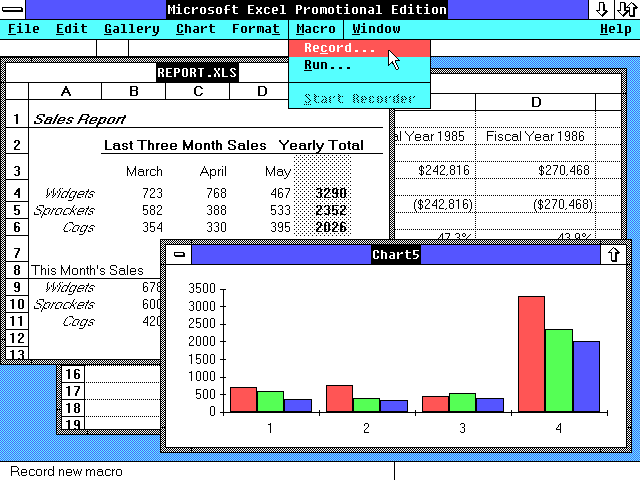 Excel 2.1 (1988)
Microsoft’s epically outdated promotional video for an early version of Excel titled “The soul of the new machines”, drives home this focus on the colors, layout and printing:

To continue watching see Part 2, and Part 3
Excel was then pretty much unchallenged as the market leader for the best part of 20 years, and still holds the position quite firmly.
Google Sheets
The only real contender at the moment is Google Sheets, which — by best estimates — may be at around 20–25% market share. GSheets debuted in 2006, but didn’t really start to gain momentum until well into the ’10s. Its rise was once again linked with a platform shift, in this case to the cloud and browser based SaaS — but wasn’t as obviously accompanied with a shift in presentation as 1–2–3 was with its graphics and Excel with colors and printing. Google Sheets’ killer feature was — and still is — collaborative editing, where Excel struggles to catch up even today.
GSheets market share should still be qualified by saying that a lot of people use both. It is rare to find Google Sheets users that don’t at least have access to Excel as well (and many use them interchangeably based on the task at hand), where-as a lot of people live squarely in Excel-land.
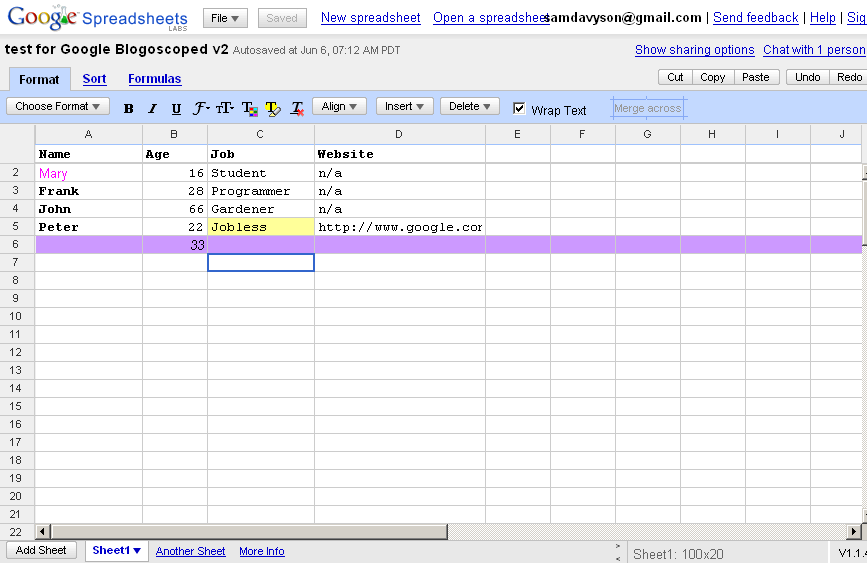 Google Sheets (2006)
Backwards compatibility is a key
Apart from the platform and presentation shifts that seem to have driven the transitions from one market leader to another, it is also important to note that each of them was facilitated by backwards compatibility. 1–2–3 could read VisiCalc files, Excel could read 1–2–3 files and Google Sheets could import Excel files. Each then added their own features and functionality so that it made little sense to go back (apart from the current duality of Excel and GSheets).
This makes perfect sense, as spreadsheets play such a central role in pretty much any business, and a lot of investment has been made in building spreadsheet models and pull together data into spreadsheets that would be very painful to leave behind or have to rebuild in a different, incompatible system.
This goes, not only for the spreadsheet files themselves, but also users’ spreadsheet know-how. People like to leverage their existing skills. It was therefore important with each shift that people could largely build their models and formulas in the same way as before. This is why the syntax we use in today’s spreadsheet software bears a lot of resemblance to the syntax VisiCalc invented 40+ years ago, anywhere from the A1-notation (referring to columns by letter and rows by number) to the names of functions, order of their parameters and so on.
The VisiCalc equivalent of today’s:
=SUM(135.22,C3:H3,MAX(A1:A5))
…would have been:
@SUM(135.22,C3…H3,@MAX(A1…A5))
So while there have been small changes in the syntax such as indicating formula cells with “=”, dropping the “@” that preceded function names and replacing “…” with “:” to indicate ranges, an avid VisiCalc user would largely recognize the spreadsheet formulas we type into Excel and Google Sheets today. That said, the current syntax was set by Excel, has since been encoded in the Office Open XML standard and is what every spreadsheet-based software goes to — often great — lengths to support today.
Lessons for software innovators
I believe there is a strong lesson to be learned from this history for software innovators, namely:
Understand which shoulders you are standing on, and meet your users where they are already comfortable.
The more your users can:
- Reuse their existing assets (in this case their existing spreadsheets)
- Leverage their existing skills (here their formula building and modeling skills)
- Minimize the change to their ways of working when adopting the tool
…the more likely your software is to succeed.
We take this to heart at GRID. One of our product principles is “Meet people where they are” — and as we are here to help people present and report on their spreadsheet models and data, for us that means “meeting them” in Excel.